The classic anomeric effect operates across a carbon atom attached to oxygens. One (of the two) lone pairs on the oxygen can donate into the σ* orbital of the C-O of the other oxygen (e.g. the red arrows) tending to weaken that bond whilst strengthening the donor oxygen C-O bond. Vice versa means e.g. the blue arrows weakening the other C-O bond. This effect tends to increase charge separation and the question then arises: how large can this effect get? To try to find out, we are going to do some crystal structure mining in this post!
I need to list the parameters defining this crystal mining.
- Firstly, we note that the donating lone pair has to overlap in an anti-periplanar fashion with the C-O bond that is going to weaken. To get a handle on this overlap we are going to define the absolute value of the two torsion angles, T1 and T2 (minimum value 0° and maximum value 180°). Since a lone pair has no defined position in crystallographic coordinates, we will have to infer the angle of the lone pair from that of the torsion angles RO-CO and R’O-CO, which will then constitute a measure of how the oxygen lone pairs are oriented.
- If T1 or T2 have values of ~60° we might infer that one lone pair torsion may have a value of 60+120° = 180° and therefore that it is indeed antiperiplanar to a C-O bond.
- Next we define the two C-O distances. If BOTH the oxygen lone pairs are oriented at ~180° to the C-O bond, then both the red and the blue resonances can occur more or less equally and so each C-O bonds is both strengthened and weakened. The anomeric effect operates in both directions, meaning the two C-O bond lengths are more or less equal in length.
- If however only one of the lone pair torsions is 180° and not the other, a bond length inequality will be set up, which can be detected crystallographically.
Now for a search of the Cambridge crystal structure database. The definition is shown below, and included constraining the central carbon to 4-coordination (R = C or H), no errors and R < 0.05.
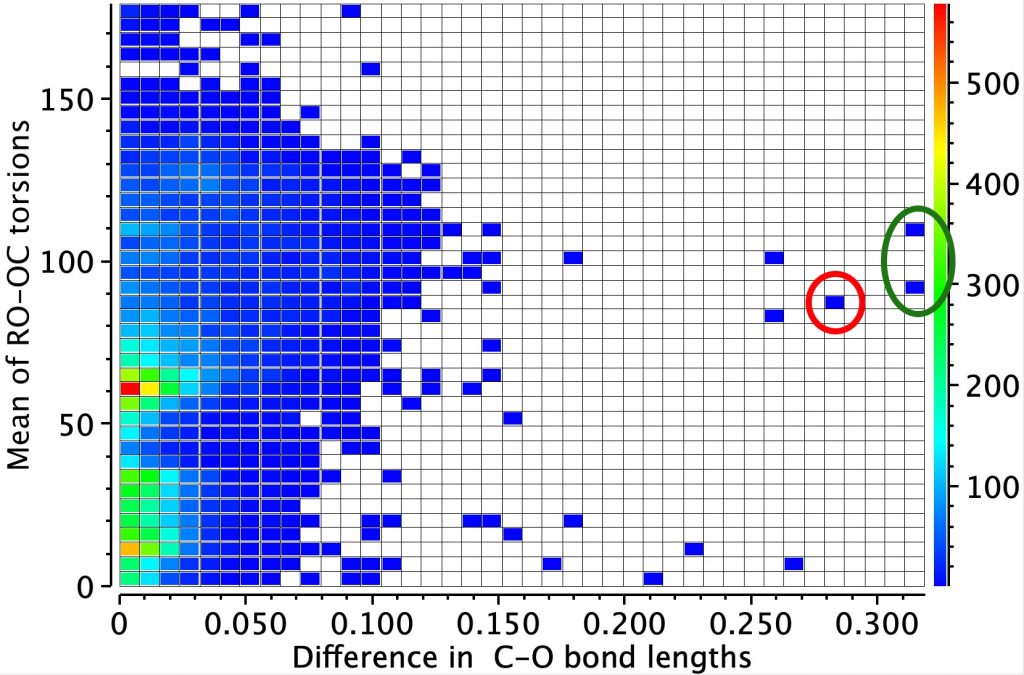
Firstly the result for the two C-O distances. The point ringed in red is clearly an error, but the two ringed in green are real (IFJIO and IFEJUA) for which extreme inequality of the two C-O bond lengths appears. But before discussing this, I note that there is a double “hot spot” (red) for which the two C-O distances are more or less equal.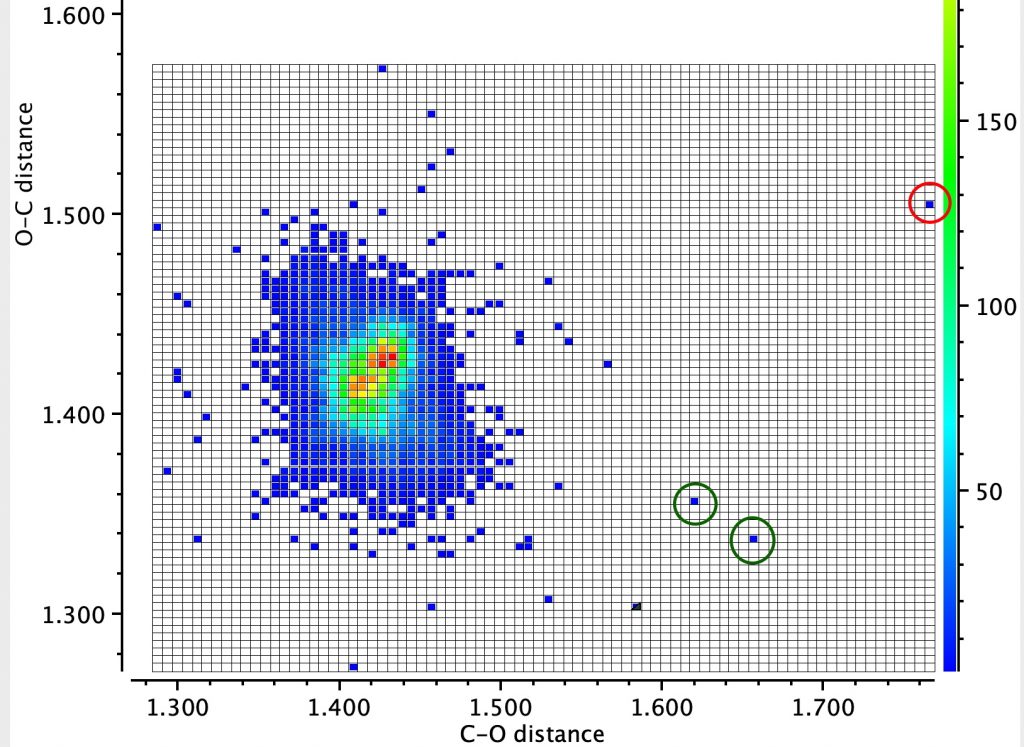
By constraining one of the R groups to R=H, a single hot spot is obtained showing unequal bond lengths (~1.395, 1.430Å) whilst the double hot spot only appears when both R are C. Something interesting going on there?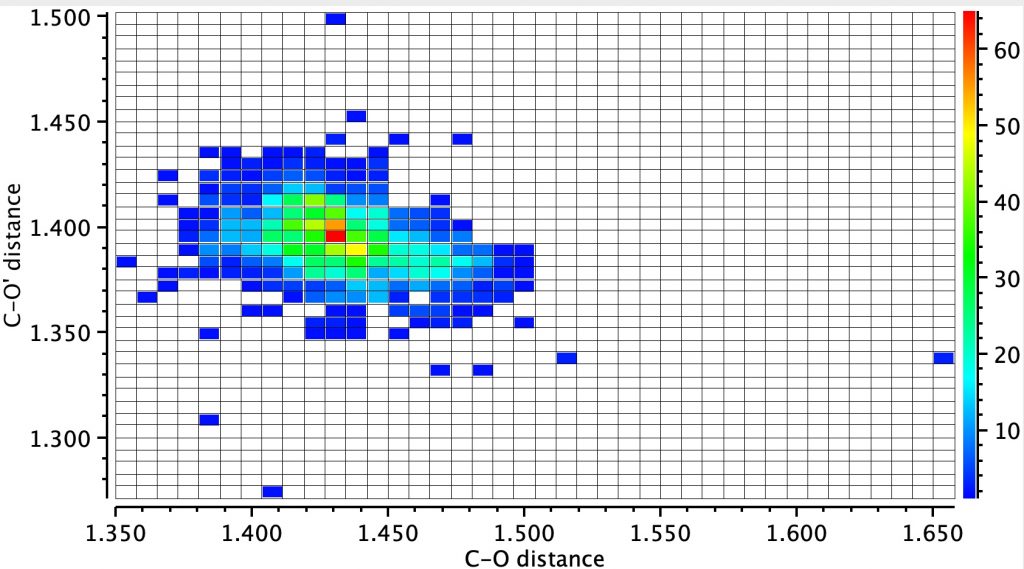
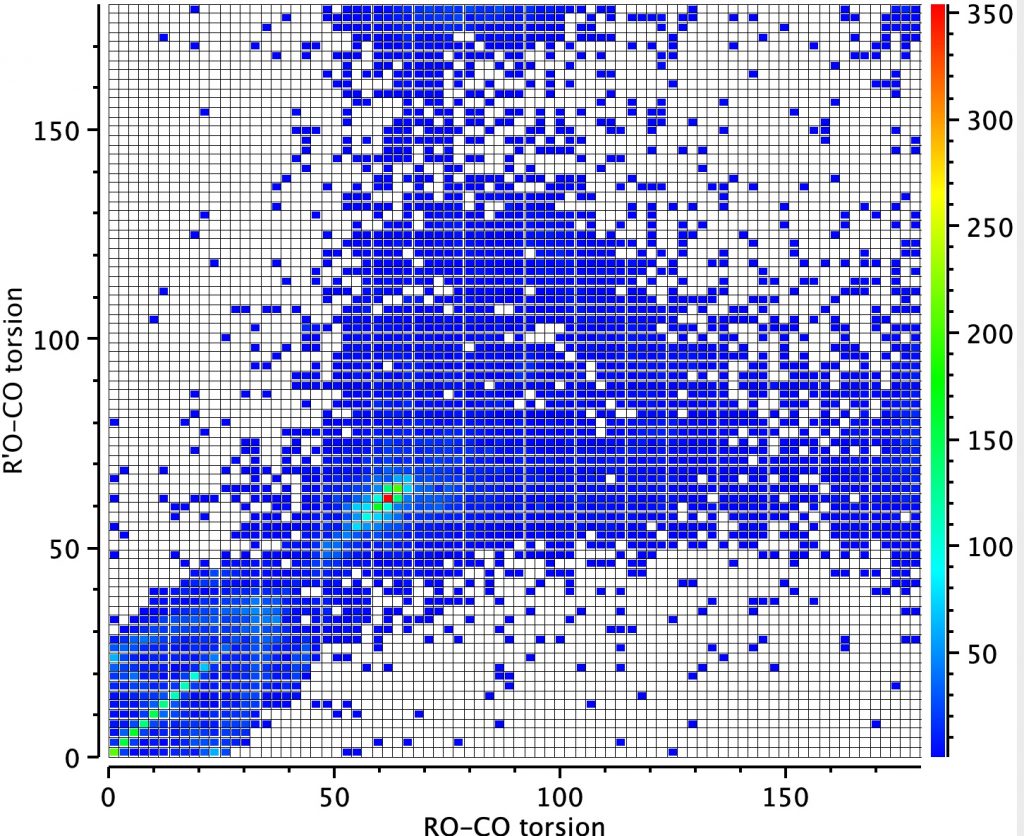
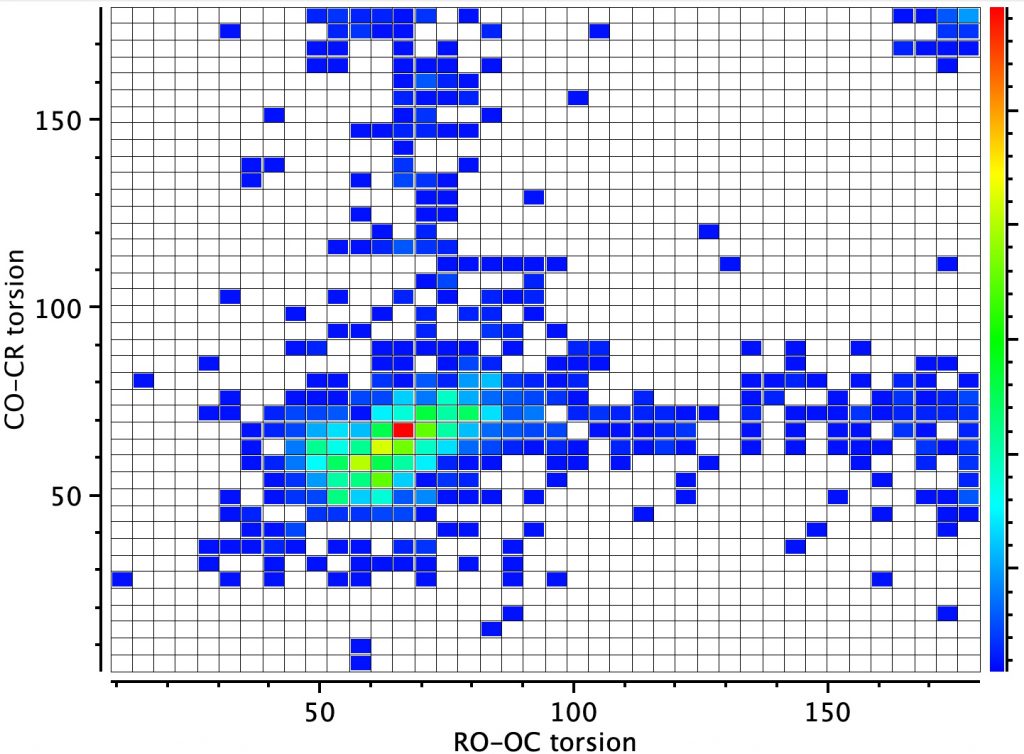
Next, a torsion plot is more directly revealing of an operating anomeric effect. The hot spot appears at values of each torsion of 60° which suggests that the most common conformation for these molecules is to have both oxygen atoms aligning with one lone pair antiperiplanar to the other C-O bond. This would not result in bond length inequality.
However, the remaining distribution shows both a vertical and a horizontal distribution in which only one of the oxygen atoms aligns a lone pair antiperiplanar to the C-O bond. According to the argument presented above, these should show bond length inequality. To check that the distribution above is not due to constraints of rings, a search in which both C-O bonds are specified as acyclic (i.e. not part of a ring) reveals the same effect.
Next, we combine both the distance and the torsion values as below. The mean of both torsion angles at 60° is again a hot-spot and this is associated with no difference in the two bond lengths. Conversely, the maximum difference in the bond lengths occurs at a mean torsion of ~ 90°, which can occur when the individual torsions are 60 and 120°, the former of which implies a lone pair is antiperiplanar to the C-O bond. The rings again correspond to those identified above.
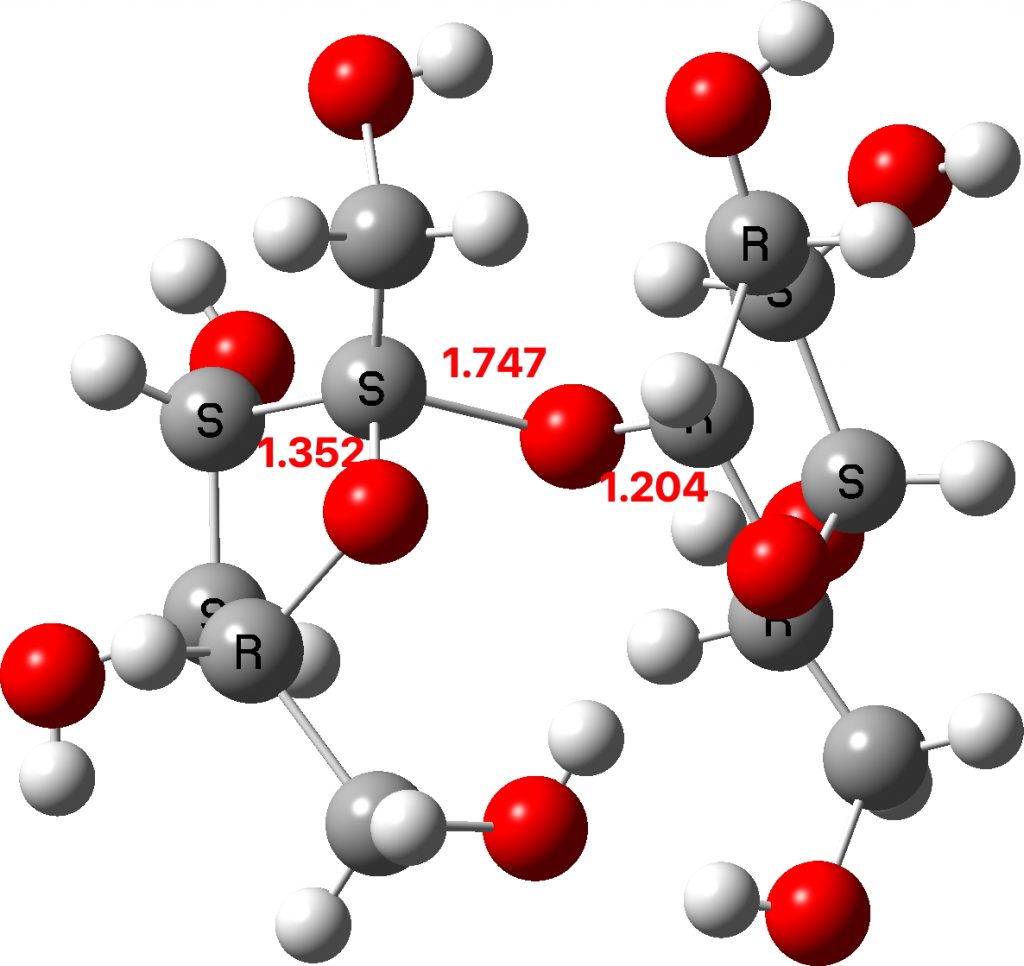
Now to investigate those ringed molecules. The red one is SUCROS35[1] which was reported in 2012 as a high pressure polymorph of sucrose in which the hydrogen bonding pattern of regular sucrose has been substantially modified. Could application of pressure really induce an enormous anomeric effect?
One way of applying a “reality check” is to calculate the geometry at a high level DFT level (ωB97XF/Def2-TZVPPD) which reveals that the three C-O bond lengths annotated above are predicted as 1.400, 1.416 and 1.392Å (FAIR Data DOI: 10.14469/hpc/8374). These are regular C-O lengths and exhibit nothing unusual. We might conclude that the crystal data for this specific set of coordinates is in error and should certainly be re-investigated.
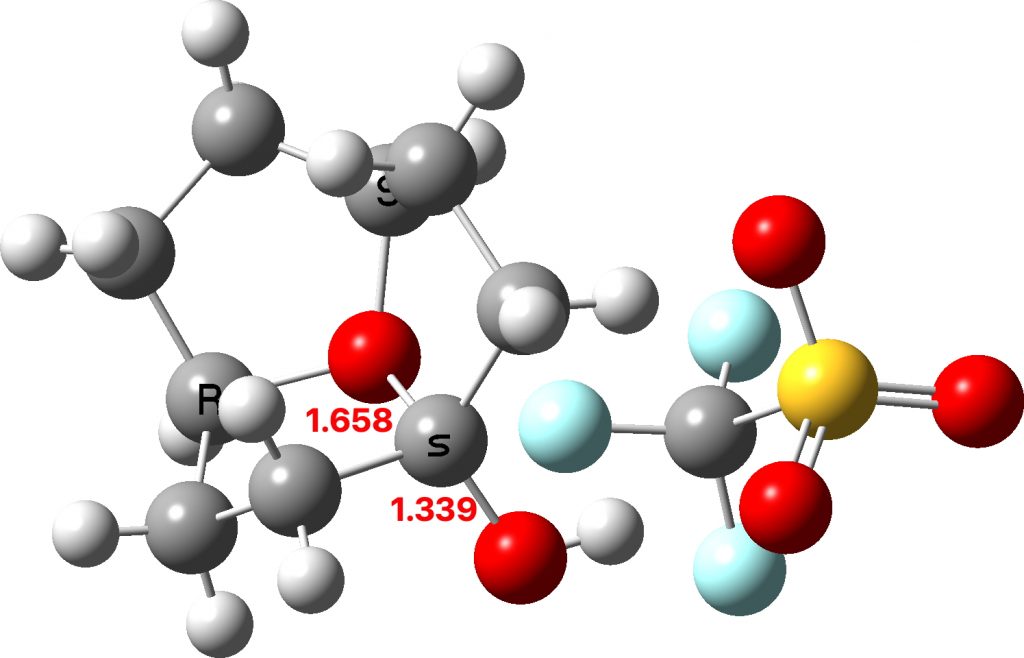
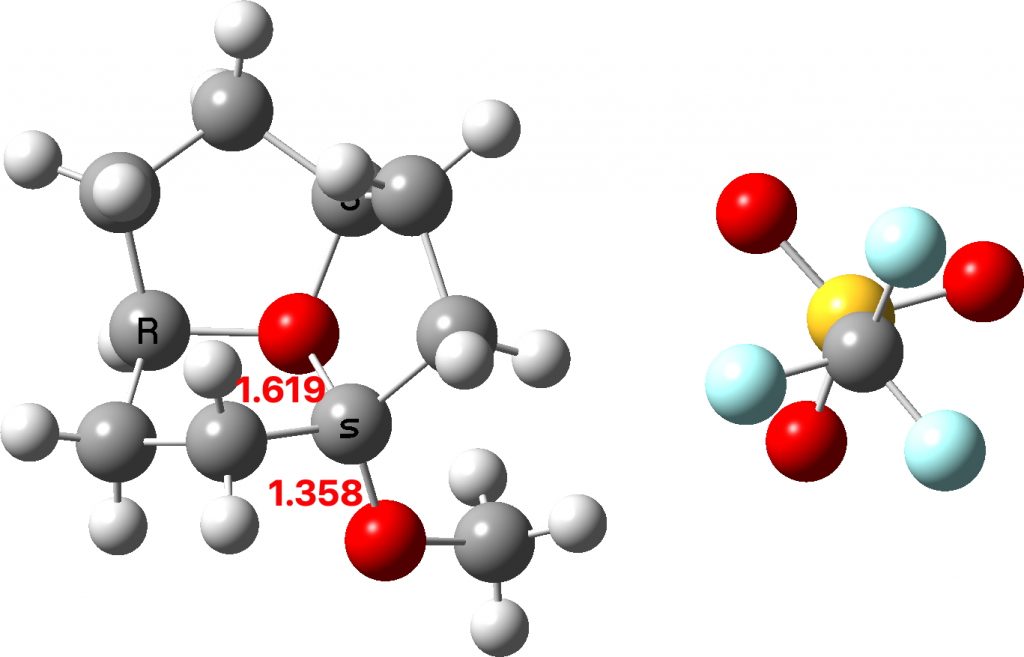
The two real examples of large bond length difference are both related[2] and the larger of which is the version with R=H,C rather than R=C,C. The example with R=H is certainly augmented because of the hydrogen bond set up to the triflate group, which tends to forming an oxyanion, which is a stronger electron donor than e.g. methoxy.
The reason for these record breakers is that the anomeric effect in this case induces not so much charge separation as charge relocation. One way of quantifying the effect is to calculate the NBO E(2) interaction term between the donating oxygen lone pair and the accepting C-O σ* orbital. Click on the image below to view this interaction (blue = magenta; red = orange).
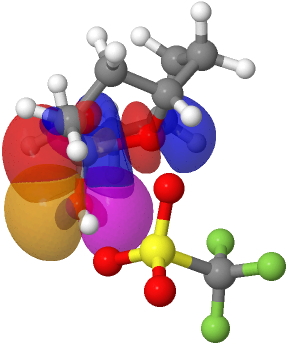
The values are 60.8 (IFEJIO, structure at DOI: 10.5517/cc111jxj), 46.5 (IFEJUA, structure at DOI: 10.5517/cc111jyk) and 20.8 (SUCROS35, structure at DOI: 10.5517/ccx16sx) kcal/mol. The latter in fact corresponds to a “normal” anomeric effect, which shows that our two record breakers are more than twice as large!
I conclude by noting that in the above distribution plots, there are five or so other “outliers” which need verifying and which may also prove interesting. We have yet to find the largest anomeric effect exhibiting charge separation rather than relocation.
References
- E. Patyk, J. Skumiel, M. Podsiadło, and A. Katrusiak, "High‐Pressure (+)‐Sucrose Polymorph", Angewandte Chemie International Edition, vol. 51, pp. 2146-2150, 2012. https://doi.org/10.1002/anie.201107283
- G. Gunbas, W.L. Sheppard, J.C. Fettinger, M.M. Olmstead, and M. Mascal, "Extreme Oxatriquinanes: Structural Characterization of α-Oxyoxonium Species with Extraordinarily Long Carbon–Oxygen Bonds", Journal of the American Chemical Society, vol. 135, pp. 8173-8176, 2013. https://doi.org/10.1021/ja4032715

