The previous post set out a problem in conformational analysis. Here is my take, which includes an NCI (non-covalent interaction) display as discussed in another post.
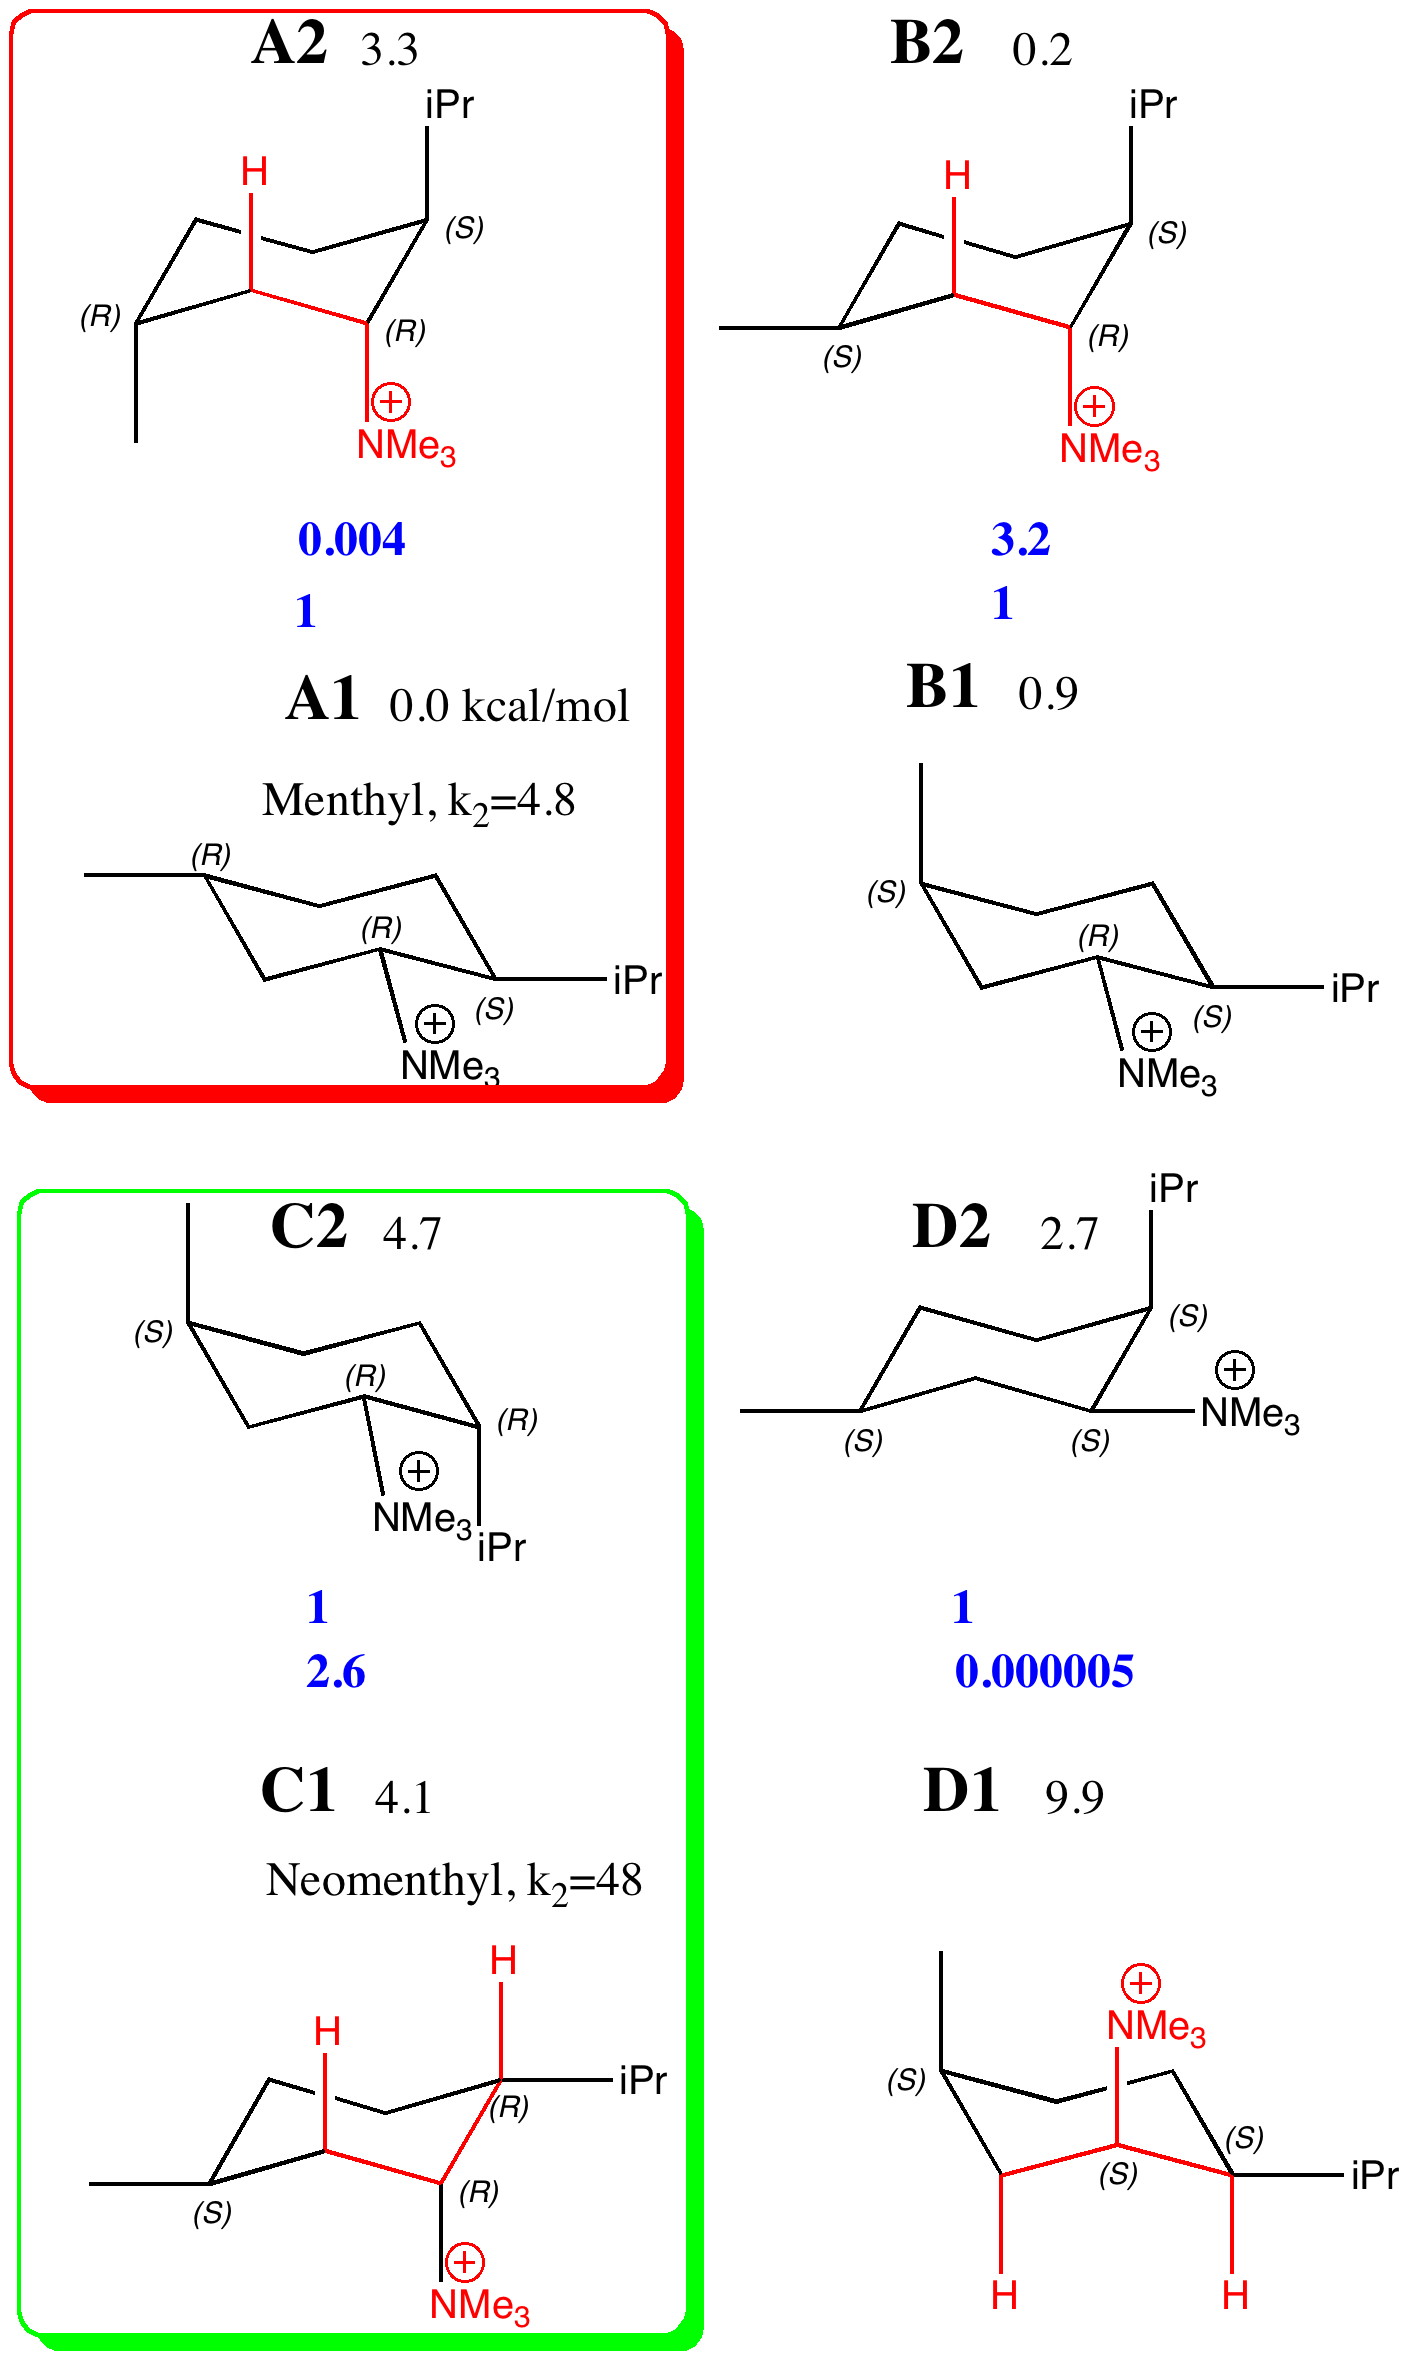
The lowest energies of the four diastereomers A-D, each in two conformations (1/2) were calculated at the ωB97D/6-311G(d,p)/SCRF=ethanol level, and are shown here relative to A1 (kcal/mol) as free energies. The values of ΔΔG of each pair (relative to the lower energy conformation) are converted to relative concentrations using ΔΔG = -RT Ln K and these are shown in blue. Those conformations where a C-H bond is aligned anti-periplanar (app) with the C-NMe3 bond are highlighted in red. Various aspects of the questions posed include:
- Those conformations with two app combinations are likely to result in a mixture of two alkenes E and F (shown in the previous post), and likewise those with only one app alignment will give a single alkene.
- The concentration of the neomenthyl system (C) favours the conformer C1, which is also the one with app allignments. This will react readily. The menthyl system A has only a low relative concentration of A2, and so will react slowly. The experiments show the rate is about 10 times less than C, whereas the ratio of relative concentrations is larger. This may be due to difference in the transition state for the elimination, or possibly effects due to the presence of a counterion.
- The concentration of D1 is the lowest of the four pairs of conformational isomers. This might be due to buttressing, in which the relative proximity of the NMe3 and iPr groups forces the former into closer proximity with the axial methyl than is found in A2, the other conformer with an unfavourable 1,3-diaxial interaction.
- The relative energies of most of the pairs of combinations of conformers/diasteromers are interesting, and I leave it to you to play with them and draw conclusions (or detect mysteries).
I thought I would finish by adding an NCI analysis using a wavefunction computed for ωB97D/6-31G(d,p)/SCRF=ethanol. The green surfaces are indicative of regions where non-covalent interactions are occurring (which include electrostatic and van der Waals effects). The colour scheme is set to blue(ish) to indicate more attractive NCIs (such as strong hydrogen bonds), green to indicate weak(ish) NCIs, with a red or orange tinge indicating a repulsive NCI.
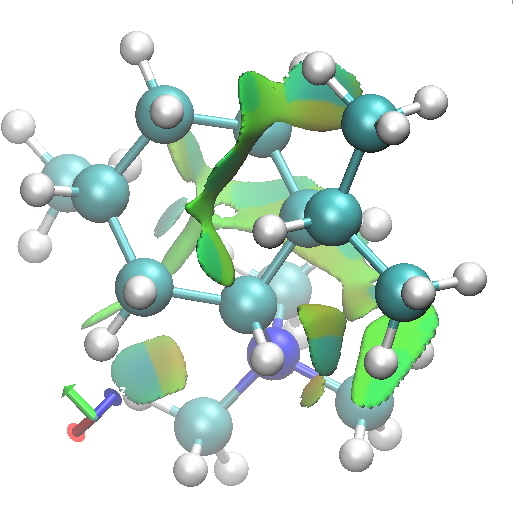 A2 diaxial. Click for 3D. |
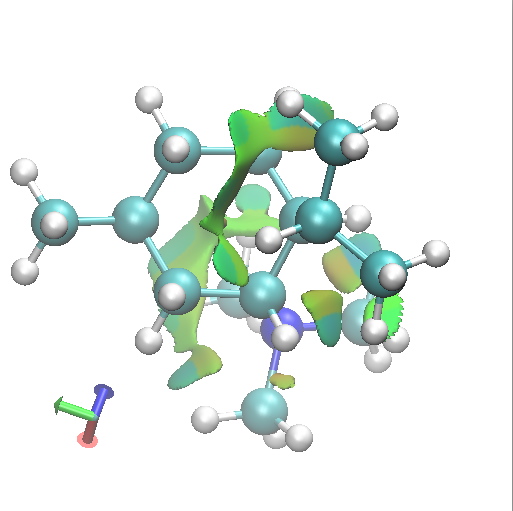 B2 Axial-equatorial. click for 3D. |
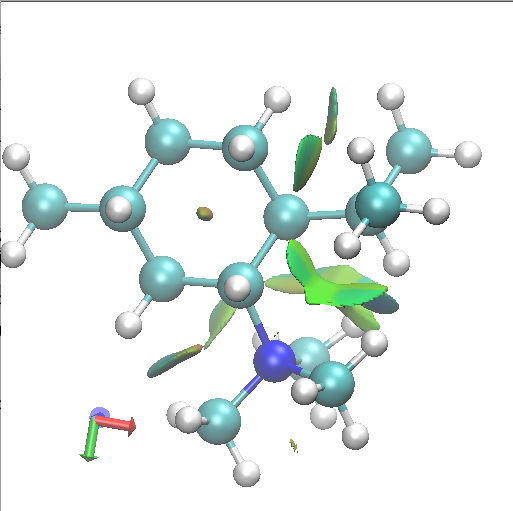 A1. Di-equatorial. Click for 3D. |
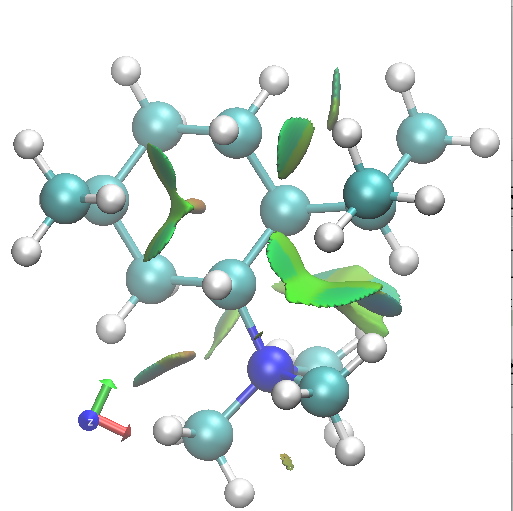 B1.Di-equatorial. click for 3D. |
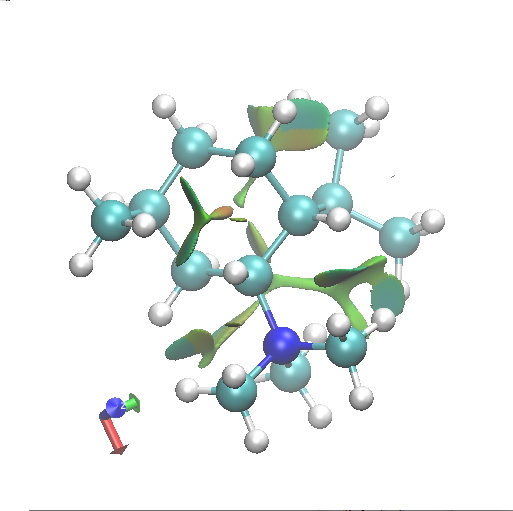 C2. Equatorial-axial. Click for 3D. |
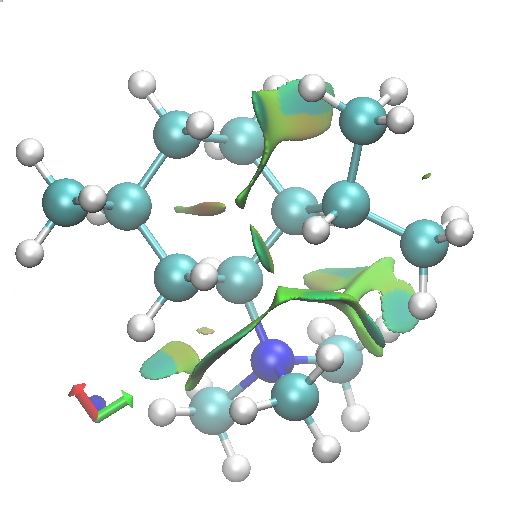 D2. Equatorial-axial. Click for 3D. |
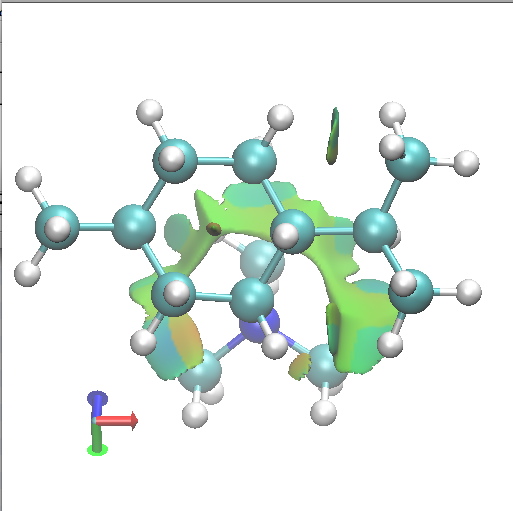 C1 SRR. Axial-equatorial. Click for 3D. |
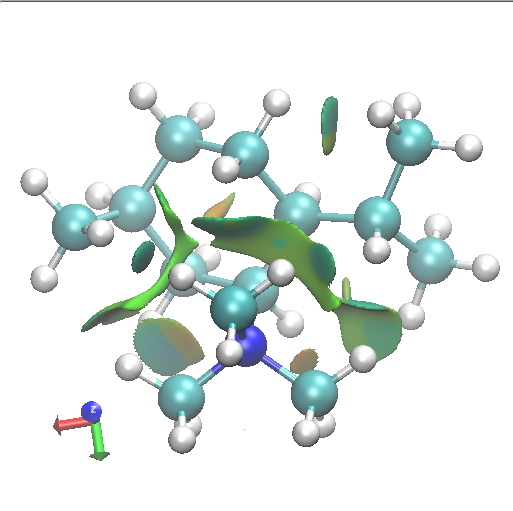 D1 SSS. Axial-equatorial. Click for 3D. |
Amongst the many features visible in these plots is the strong 1,3-diaxial NCIs seen for A2 and particularly D1 and the conformational variability in the NCI between the iPr and NMe3 groups.
Tags: conformational analysis, iPr, Julia Contreras-Garcia, lower energy conformation, NMe, non-covalent-interactions, Tutorial material
[…] that I do not spoil your fun, I will not reveal (my) answers here, but in the next post. Try writing down answers to these two questions, and see if they agree with […]
[…] Henry Rzepa Chemistry with a twist « Updating a worked problem in conformational analysis. Part 2: an answer. […]