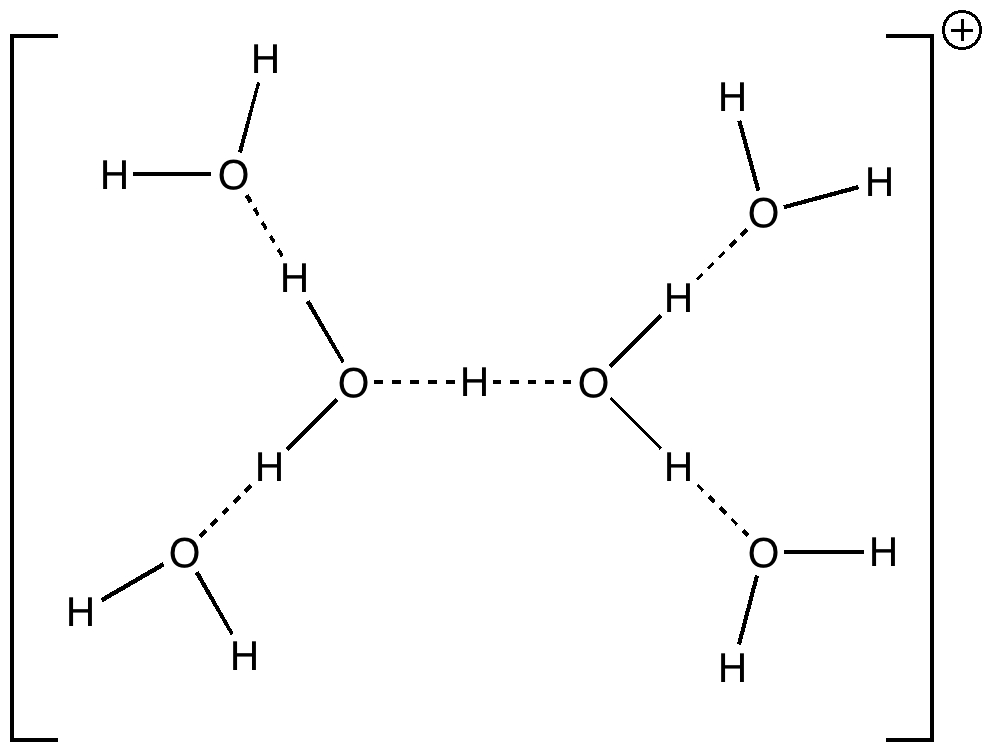
Stoyanov, Stoyanova and Reed recently published on the structure of the hydrogen ion in water. Their model was H(H2O)n+, where n=6 (DOI: 10.1021/ja9101826). This suggestion was picked up by Steve Bachrach on his blog, where he added a further three structures to the proposed list, and noted of course that with this type of system there must be a fair chance that the true structure consists of a well-distributed Boltzmann population of a number of almost iso-energetic forms.
The evidence for the structure above comes from IR spectra. These operate on a fast enough scale to freeze-out individual forms, and therefore represent the instantaneous species rather than time averaged environments. A lively debate started on Steve’s blog, starting with Steve’s observation that the original article had reported only experimental results and no theoretical modelling of the proposed structure. It emerged that one way of modelling such species was within a cavity surrounded bv a continuum field modelling the bulk solvent (water in this case), and in particular one must properly optimize the structure and calculate the force constants within this field. When this is done, one significant difference between a simple gas-phase model of the structure above and its continuum-field structure emerges. In the former, the central O…H…O motif is symmetric (indeed the entire molecule is C2-symmetric). When the solvent field is applied, this unit desymmetrizes, ending up with one short (1.118Å) and one long (1.295Å) bond. I have transferred discussion of this from Steve’s blog to this one so that the resulting vibrations of this species can be shown here in animated form (its not possible to post animations in the comment field of a blog).
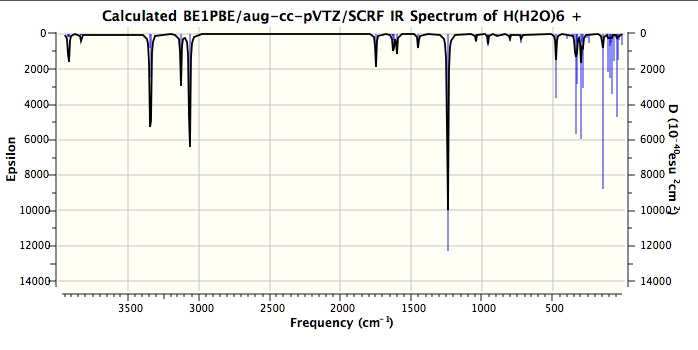
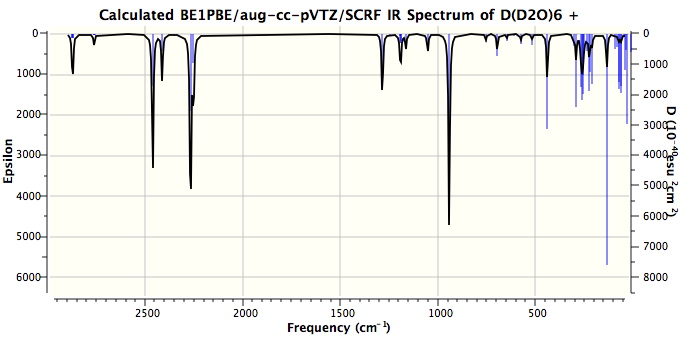
Firstly, the model. It is a PBE1PBE/aug-cc-pVTZ (the DFT method being the same as Steve used in his modelling, the basis set being rather better) and the continuum field applied was as SCRF(CPCM,solvent=water). The complete calculation can be inspected at DOI: 10042/to-4261. It is also important to remember that the force constants are harmonic. The resulting vibrations with the highest calculated intensities are tabled below.
| Obs | 1H freq | Intensity | 2H freq |
|---|---|---|---|
| – | 338 | 481 | ? |
| 654 | 476 | 429 | 438 |
| 1202 | 1242 | 3837 | 942 |
| 1746 | 1749 | 599 | 1284 |
| 2816 | 3065 | 2829 | 2268 |
| – | 3127 | 913 | 2253 |
| 3134 | 3341 | 2018 | 2462 |
| 3134 | 3347 | 668 | 2424 |
One might note that the vibrations in the range 3100-3300 always tend to be over-estimated using theory, in part because of incomplete basis sets, and in part because the harmonic frequencies are always 200 or more wavenumbers higher than the observed anharmonic values. The match for the mid range vibrations (1746, 1202) seems remarkably good. Only the low range value (654) is significantly out, and this may be another anharmonic effect. Added for good measure are the closest matches to each vibration when the system is fully substituted with deuterium (because of mode mixing, the modes do not always map exactly; thus the mode at 338 appears to have no exact deuteriated analogue).
The displacement vectors are shown below (click on each picture to obtain an animation).
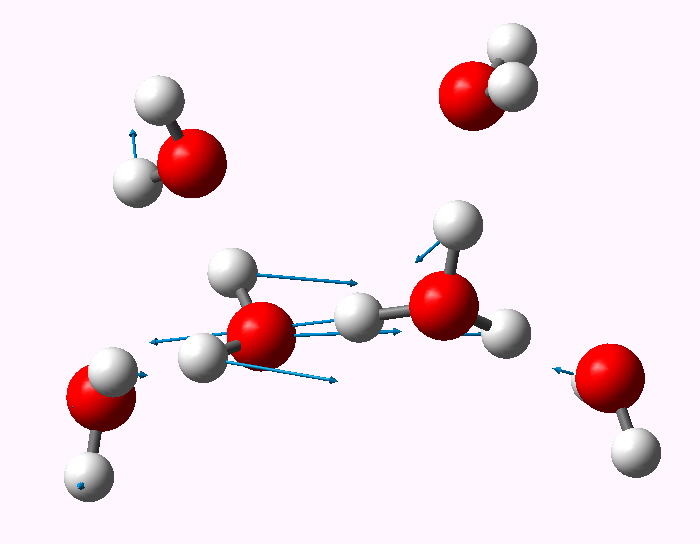 Normal mode 476 cm-1. |
 Normal mode 1242. |
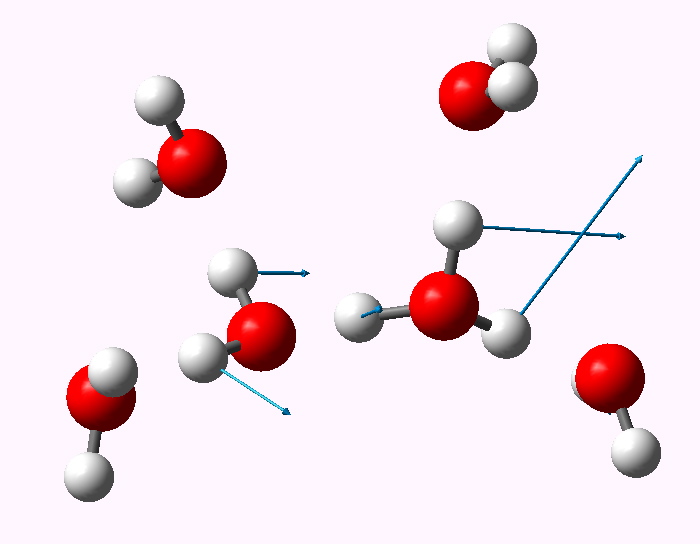 Normal mode 1749 |
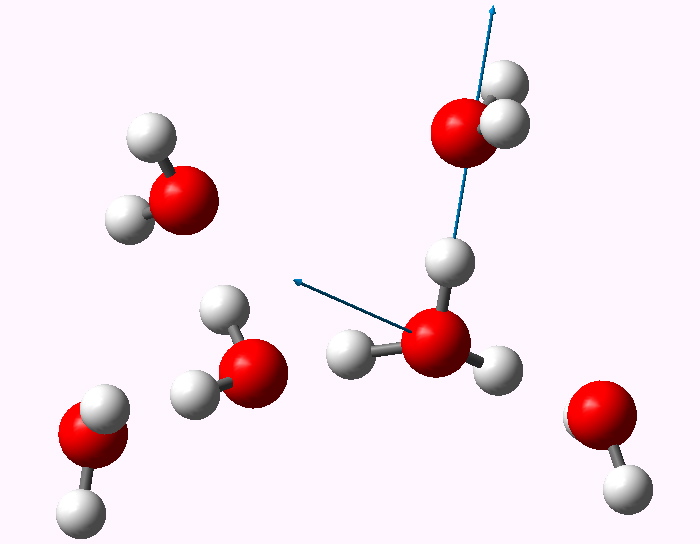 Normal mode 3065 |
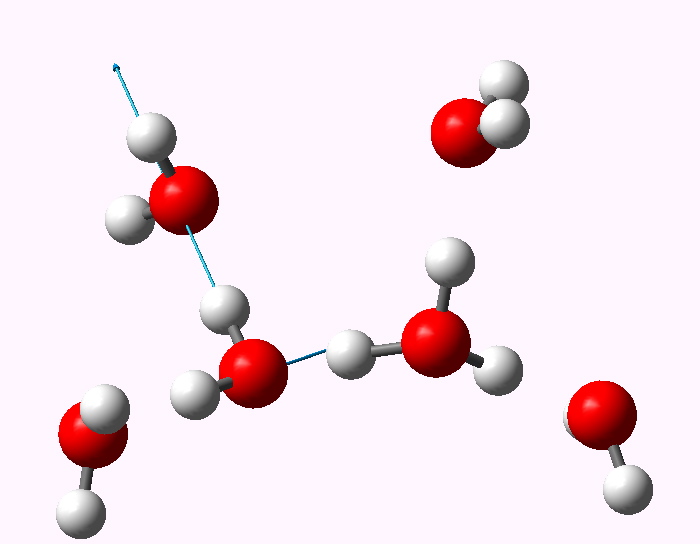 Normal mode 3341 |
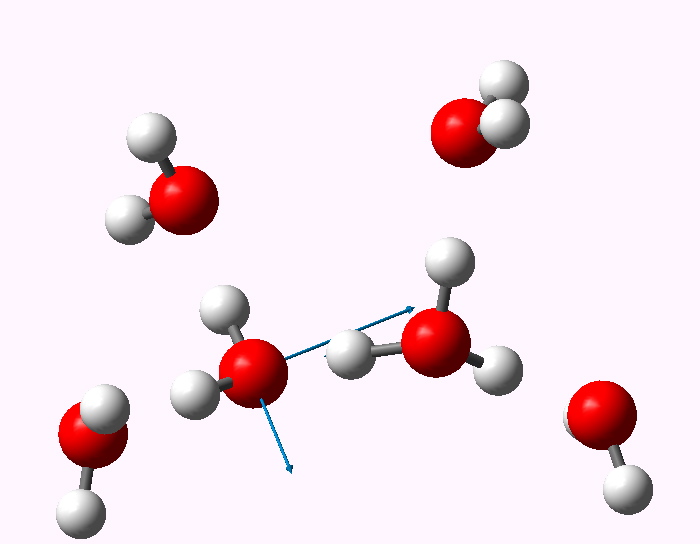 Normal mode 3347 |
The overall conclusion does seem to be that the structure shown above for the solvated proton does seem to match the observed IR peaks rather well, and that further more accurate modelling of this species might be a worthwhile endeavour.
Tags: animation, gas phase model, General, Interesting chemistry, Steve Bachrach
[…] shows a solvent bridge allows X to be concertedly transferred, this time from the oxygen to form hydronium chloride and 2 (I have not yet found the equivalent pathway to 3, but given the hydrogen bonds involved […]